Data Quality Visualization in Healthcare: Making Sense of the Data (…Assuming the Data Make Sense)
With the proliferation of available visualization and analysis tools and exponentially increasing big data, data visualization seems a very modern phenomenon. But it isn’t. The power of pictorial representation of numbers and statistics to uncover insights and influence decision making has been valued for centuries.
French civil engineer Charles Joseph Minard created what statistician and data visualization pioneer Edward Tufte calls “probably the best statistical graphic ever drawn” in 1869.
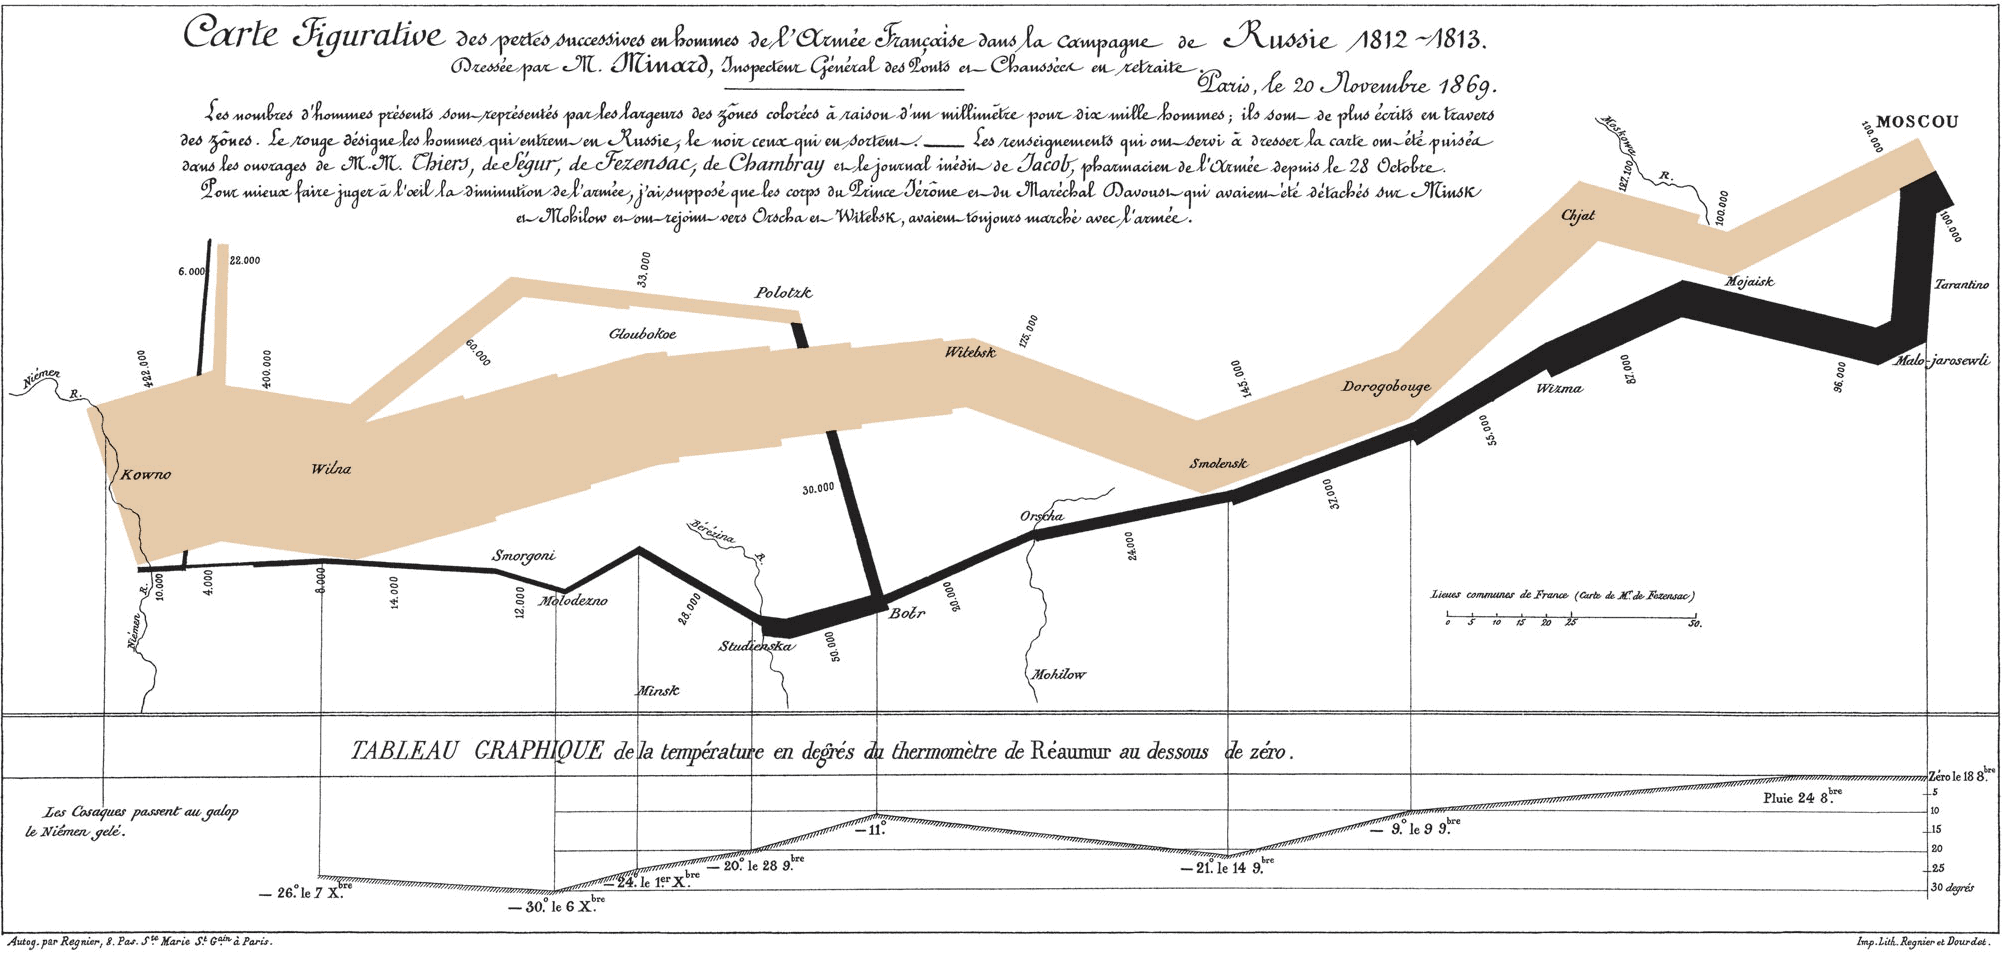
A flow map of Napoleon’s ill-fated Russian campaign of 1812-1813, the visualization “displays six types of data in two dimensions: the number of Napoleon’s troops; the distance traveled; temperature; latitude and longitude; direction of travel; and location relative to specific dates.” It has been called “a brilliant example of how a complex story can be told as simply as possible.”
That description is essentially at the heart of all successful data visualizations—they take several data points whose significance would be lost in a list or spreadsheet and use maps, charts, or graphs to depict the information visually, uncovering insights not easily seen in the raw information.
Healthcare has more data accumulating at a greater velocity than any other industry today. Visualization is necessary to take advantage of big data and make sense of it in healthcare.
The beginning of visualizations for healthcare and public health
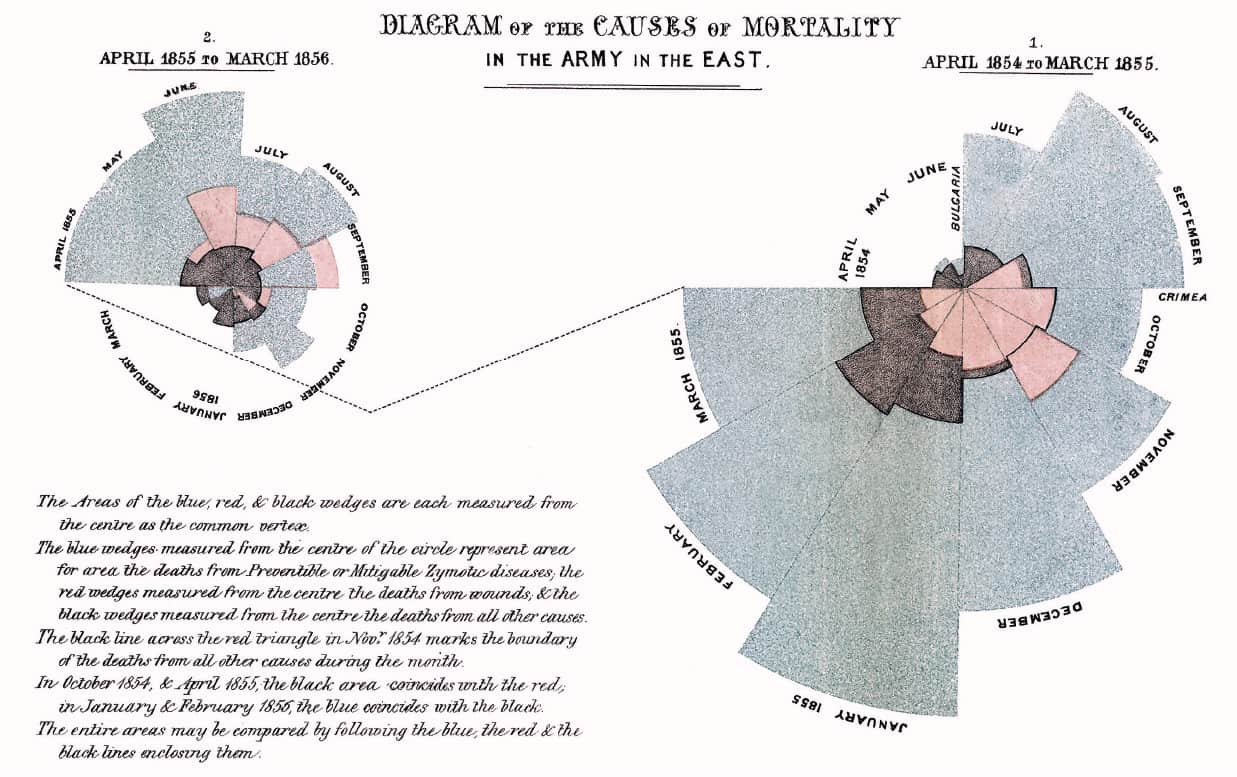
Just as data visualization has been around for centuries, so have its healthcare applications. A “primary example” of “the origins of data visualization in healthcare” is Florence Nightingale’s polar area chart depicting causes of mortality for soldiers during the Crimean War. It strikingly displayed the contrast between the small number of soldiers who died in battle or from battle wounds and the much larger number who died of diseases, such as dysentery, that could be prevented with proper sanitation techniques. An article in the Journal of Advanced Nursing (JAN) noted, “Florence realized that bringing this information to life in a simple and clear way was essential for it to be quickly understood and action taken to improve practice.” The authors termed her method of direct and effective data visualization “the Florence effect.”
COVID and the “curve”
The most prominent example of widespread data visualization in health is the COVID-19 pandemic: from choropleth maps showing number of cases per county to more sophisticated graphs charting demographics and social determinants of health to the notorious COVID curve graphs. These visualizations allowed public health officials to identify trends and develop evidence-based recommendations for public health and medical interventions. An increase in health tech utilization and telehealth during the pandemic contributed to the predominance of visual health data communication.
Other healthcare applications
Outside of global crises, there are many benefits to using healthcare data visualization routinely. The ability to access and review large numbers of EHR data immediately, allows clinicians to improve patient outcomes, aid diagnoses, and determine the most effective treatment plan for an individual patient’s health.
Data visualizations also support quality improvement initiatives for healthcare providers by integrating complex data sets, making it easier for physicians, administrators, and other healthcare professionals to analyze processes and methodologies and make data-informed changes.
Payers can use visualizations to study trends in population health, evaluate the performance of value-based care providers, and identify areas for benefits improvement or care management. An article in Health IT Analytics points out the value data visualizations have to respond to “changing payment models [that] are putting pressure on clinicians to have instant access to actionable information about their patients, their performance, and their potential to close lingering gaps in care.”
Breathing life into quantitative analytics
An article by visual analytics platform Tableau gets to the crux of how the right visualization can invigorate an otherwise mind-numbing list of numbers and statistics: “Good visualizations allow people to gain insight from complex data at a glance. They highlight the relationships between measures. They explain concepts and tell stories. They engage the mind in ways looking at the raw data will not.”
Data dashboards take the functionality of a single visualization a step further, offering simultaneous and interactive visualizations in a user-friendly format. An interactive dashboard offers the ability to drill down into specific areas of charts and graphs for greater detail, allowing researchers and analysts to take a deep dive into the data and uncover novel insights and needed improvements.
Caveats and pitfalls
No solution is infallible, however, and this is certainly true of data visualization. If the data weren’t reliable to begin with, no visualization, no matter how attractive, will change that. Any visualization based on dirty, biased, or incomplete data will likely do more harm than good. If healthcare organizations do not first ensure they have high-quality clinical data, visualization is a fruitless exercise.
Similarly, it’s imperative that healthcare payers and providers not make the assumption “more is better” in the world of data, nor should they presume “all data is good data.” Simply having more data does not guarantee that a quantitative analysis will be more reliable.
A solid foundation is key to a trustworthy and effective visualization. First, the data need to be cleaned, curated, and validated. Second, the analysis of these data should yield actionable insights. Lastly, these insights should be viewed in the context of the data and applied to the specific use case under consideration or specific research question being asked. Only with a clear understanding of the outcomes and their implications can a useful, and accurate, visualization be built.
Verinovum’s Data Curation as a Service (DCaaSSM) solution ensures that the clinical or claims data set you wish to visualize is complete and comprises only high-quality data elements.
Verinvoum’s dashboards put data quality results at your fingertips
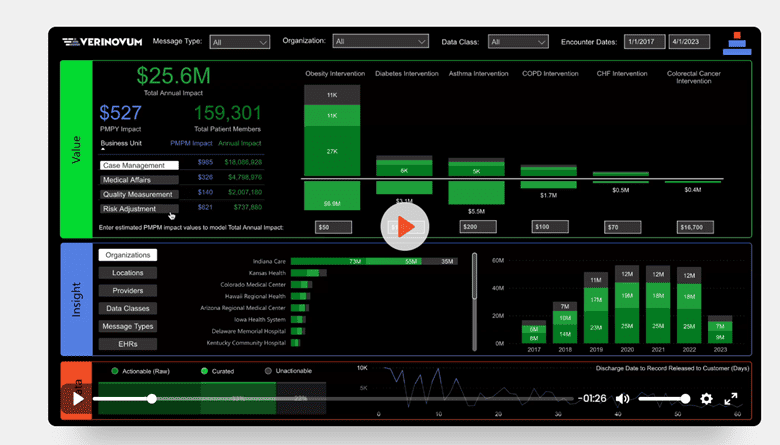
We at Verinovum have developed our own data visualization dashboards so our clients can easily see how our DCaaS solution improves their data quality and their bottom line. An Executive Overview dashboard illustrates the financial impact of data quality improvement, breaks down business units and displays which conditions or use cases are most important. Then, Verinovum determines the net financial benefit by multiplying the financial impact of having one new patient for each use case by the number of new patients added to the use case during the data curation process.
Executive Overview Dashboard:
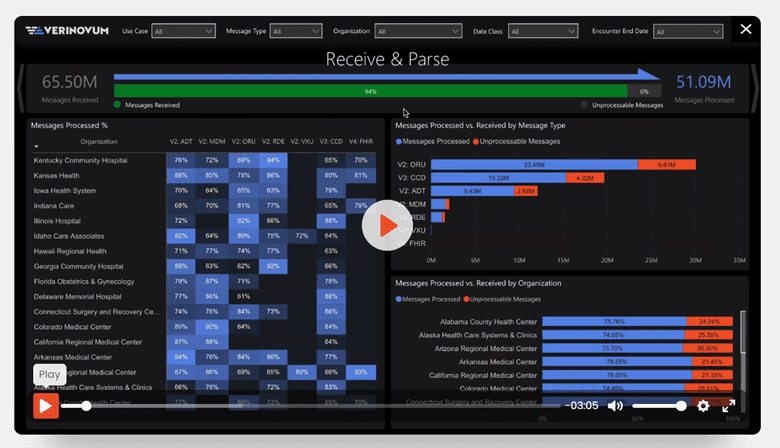
A Data Quality dashboard assesses operational trends on all the activities taken to make a client’s raw data more actionable. We strive to lift the quality and actionability of data as much as possible to support a client’s business objectives. This dashboard highlights exactly how Verinovum improved the quality of the data. The dashboard screen, broken into thirds, displays raw data, steps taken in the data curation process, and the overall lift in data quality resulting from Verinovum’s solutions. Users can then drill down and amplify each of the 10 steps in the data curation process.
Data Quality Dashboard:
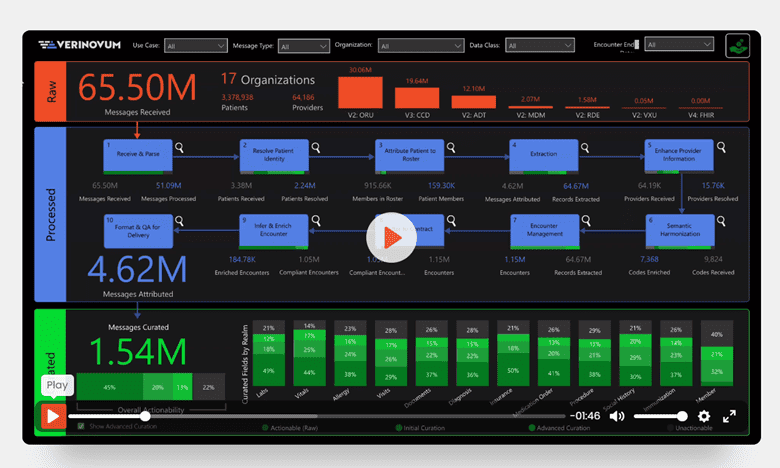
Drill Down of Data Quality Dashboard:
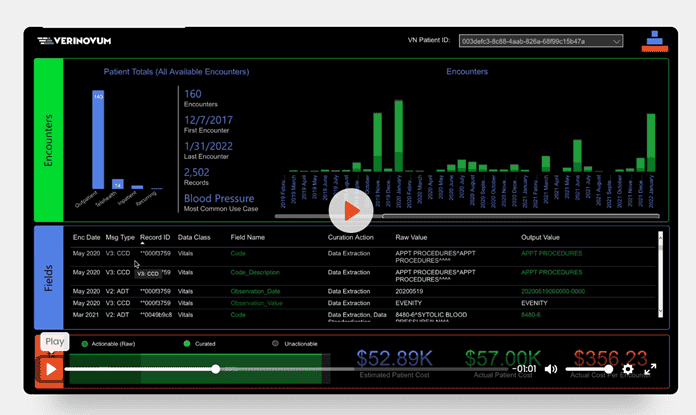
The information available on the Patient-Level Quality Assurance dashboard instills confidence that the actions taken on the data were clinically relevant and tied to the use cases of import. This dashboard provides a way to certify that the data support the outcomes listed. A data lineage report, available on this dashboard, takes every message tied to a patient encounter and breaks down exactly what actions DCaaS took on the data.
Patient-Level Dashboard:
As with any effective data visualization, Verinovum’s dashboards paint a clear, easy to digest picture of how much data quality is improved after applying the nearly 350K data transformation rules. Complex processes can be broken down, and the financial impact of our DCaaS is readily apparent. Explore the dashboard further here.